I recently completed the Commonwealth Bank SOC Analyst virtual experience program on The Forage, a 5-week journey that introduced me to essential security operations skills. This hands-on program gave me practical experience with industry-standard tools like Splunk while tackling realistic security scenarios.
Setting Up My Security Lab
The first challenge was getting my environment ready. I downloaded Splunk Enterprise from the official website and installed it on my Ubuntu 24.04 virtual machine. While this might sound straightforward, it was my first time configuring a SIEM tool, which presented some interesting hurdles.
Making Splunk Work For Me
After installation, I discovered that Splunk wasn't available in my applications menu. A quick solution was to launch it directly from the terminal:
cd /opt/splunk/bin
sudo ./splunk start --accept-license
With Splunk running, I imported the sample dataset provided by The Forage to begin my analysis.
Diving Into Data Analysis
The real fun began when I started exploring Splunk's powerful search capabilities. I learned how to create targeted queries like:
sourcetype="fraud_detection.csv" | top category // counts the number in each category
I then created my first dashboard by saving these visualizations:
Save As > New Dashboard > Dashboard Title =
Fraud Detection Dashboard > Classic Dashboards > Save to Dashboard
Putting It All Together
For the final challenge, I built a comprehensive dashboard to visualize fraud patterns across different demographics. Here are some of the queries I crafted:
sourcetype="fraud_detection.csv" | stats count by fraud
sourcetype="fraud_detection.csv" | stats count by age | sort - age
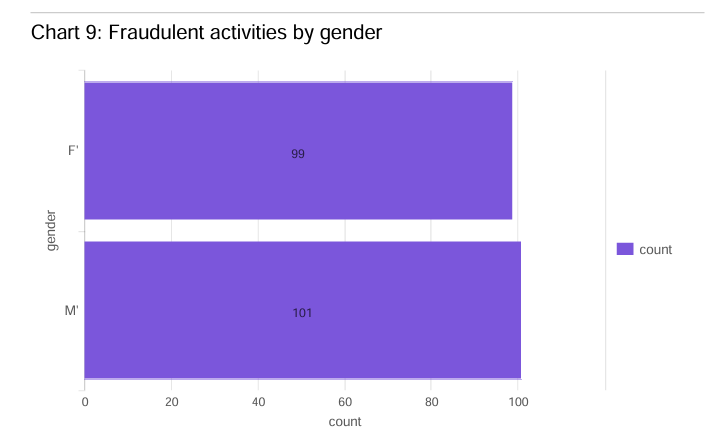
sourcetype="fraud_detection.csv" | stats count by gender | sort - count
sourcetype="fraud_detection.csv" | stats count by merchant | sort - count
sourcetype="fraud_detection.csv" | stats count age,fraud | sort - count
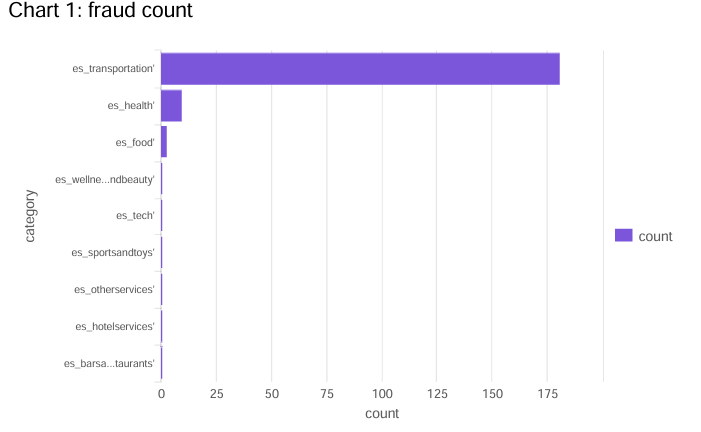
sourcetype="fraud_detection.csv" | stats count by category | sort + count
sourcetype="fraud_detection.csv" | timechart count by step
sourcetype="fraud_detection.csv" gender="F'" | stats count by category,gender | sort + count
sourcetype="fraud_detection.csv" gender="M'" | stats count by category,gender | sort + count
The results revealed interesting patterns in fraud distribution by gender: